
You have decided to create an admin panel for the backend of your website. And you want to create one with minimum time and less effort. The quickest way to create one is to go online and get yourself a nice, good-looking admin template that is just the right one for your admin templates.
So first things first. Admin templates are pre-built web pages built using HTML, CSS, and JavaScript for facilitating developers to get the application up really quickly. They don’t have to start from scratch. All they have to do is customize it and make the changes that they need. Then they can spend the rest of the time integrating the admin panel with the database.
Step 1 – Getting an Admin Template You Love
Before buying admin templates know what your requirements are and have a clear idea of what you want in terms of design and the functionalities. Otherwise, it is very easy to get overwhelmed by the number of templates that you will find.
Go through your design requirements. Know what all functionalities you would need in your template and what plugins are better suited for serving those functionalities. And then go search for one. It will help you narrow down choices and make an informed decision
I will be using StarAdmin free bootstrap admin template as an example. The template has a nice and clean design and the quality of the code is great. I find it just right to create a simple admin panel. And it is free. Also, the template is updated to the latest version of Bootstrap, Bootstrap 4 beta.
Step 2 – The Design of the Admin Panel
So how can you create a dashboard with an admin template? How to get started? To understand that let us create a dashboard of our own using an admin template.
First, let’s go through our requirement. The design that I need for the dashboard is as given in the picture.
and this the screen below the fold.
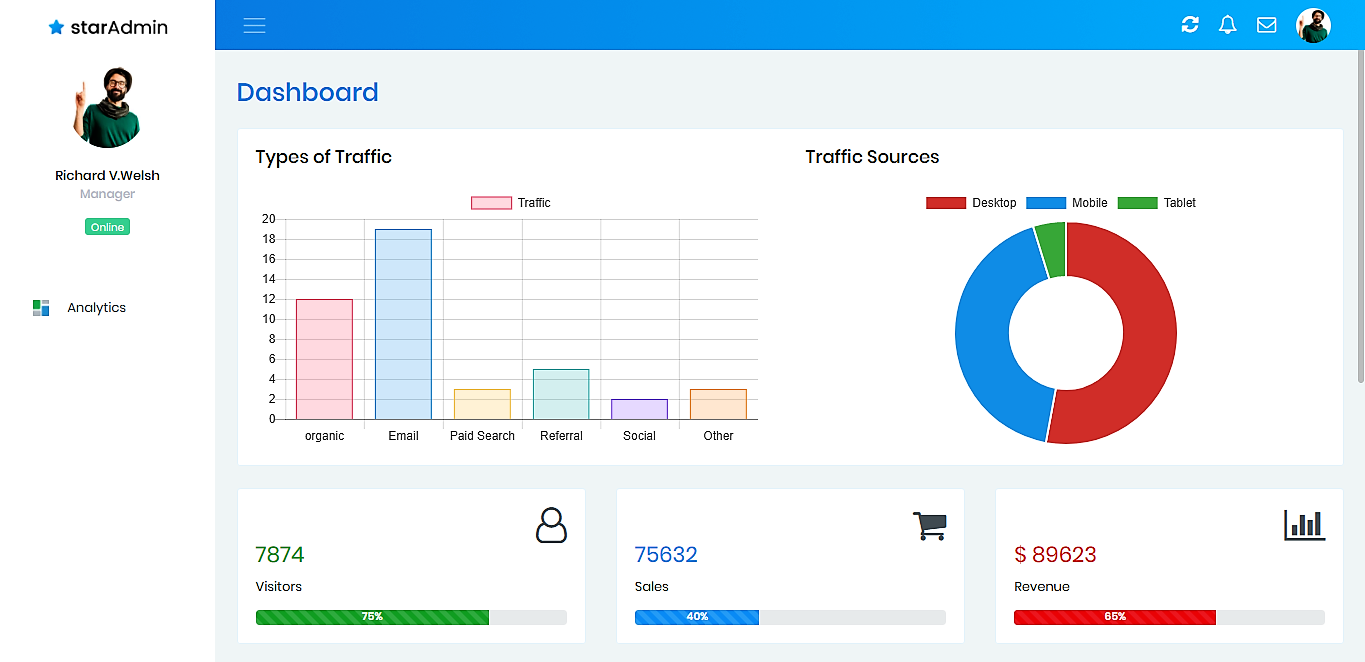
The dashboard can be divided into three parts. The navbar on the top, the sidebar on the left and the main content area. The sidebar and the navbar are common to all the pages. The content area is where all the necessary widgets go.
The top navbar of the dashboard has the navbar brand “Star” on the left end. Let us keep it that way. Next, in the navbar, there is a hamburger icon on the left. On the right end, there is a button with refresh icon, a bell icon with the number of notifications indicated and an envelope icon with an indication of the number of messages. At the end, there is a profile picture of the user.
In the left sidebar, there is only one menu item, the dashboard, for now.
In the content area, In the first card, we have a bar graph and a donut chart. The bar graph displays the types of traffic that flow into the website and the donut chart displays the device sources of the traffic.
Just below that, we have three cards that display the number of visitors, sales, and the revenue followed by another card. The last card displays the source country that the traffic is coming from on a map and more details like the conversion rate and bounce rate from each country in a table. And finally, there is the footer.
Step 3 – Let’s Get Coding
Now that we have established our requirements and decided upon the template that we are going to use, let’s get to the part where we lay our foundation and start coding step-by-step.
Installation
Before starting coding make sure to install Git, Node.js, and npm. Gulp is used as the build tool. Installing Gulp requires that you have Node installed on your computer.
This creates the foundation for the development of the dashboard.
Keep Everything Organized
Next, to keep everything organized, create a folder with the name “my-dashboard”. Let’s keep all our files in this folder.
Download the Template
Open the command prompt and change the directory path to the project folder and download the template. enter the command git clone https://github.com/BootstrapDash/StarAdmin-Free-Bootstrap-Admin-Template.git. This will download the template to your folder. Or you can download the template files as a zip folder.
Install Dependencies
After downloading the template enter the command npm install for installing all the dependencies in package.json file in the folder node_modules. After all these steps have been done, we are all set to create our dashboard.
Gulp Serve
Next, go to the command prompt, and enter the command gulp serve at the command prompt. This will open up the index.html file of the template in the default browser.
Edit the Code
Now let us start creating our dashboard. There is a blank page in the template where we can begin from. Another way is to edit the existing index.html page and edit the page. To do this, open the page in a code editor.
The navbar
In the first part, that is the navbar, the search box is not needed. So remove the code for that. At the right end, there are two extra icons that are needed. As there is Font Awesome already included in the template, all I need to do now is find the code for the right icon.
There is a refresh icon, a bell icon, and an envelope icon. When you hit ‘save’ is gulp task is running, the browser will refresh and the changes will be automatically displayed on the browser.
<!--Navbar-->
<nav class="navbar bg-primary-gradient col-lg-12 col-12 p-0 fixed-top navbar-inverse d-flex flex-row">
     <!-- Navbar brand -->
     <div class="bg-white text-center navbar-brand-wrapper">
          <a class="navbar-brand brand-logo" href="#"><img src="../images/logo_star_black.png" /></a>
          <a class="navbar-brand brand-logo-mini" href="#"><img src="../images/logo_star_mini.jpg" alt=""></a>
     </div>
     <!-- Navbar brand ends -->
     <div class="navbar-menu-wrapper d-flex align-items-center">
          <button class="navbar-toggler navbar-toggler hidden-md-down align-self-center mr-3" type="button" data-toggle="minimize">
                  <span class="navbar-toggler-icon"></span>
          </button>
          <-- navbar icons -->
          <ul class="navbar-nav ml-lg-auto d-flex align-items-center flex-row">
              <li class="nav-item">
                  <a class="nav-link" href="#"><i class="fa fa-refresh"></i></a>
              </li>
              <li class="nav-item">
                  <a class="nav-link" href="#"><i class="fa fa-bell-o "></i></a>
              </li>
              <li class="nav-item">
                  <a class="nav-link" href="#"><i class="fa fa-envelope-o"></i></a>
              </li>
              <li class="nav-item">
                  <a class="nav-link profile-pic" href="#"><img class="rounded-circle" src="../images/face.jpg" alt=""></a>
              </li>
          </ul>
          <-- navbar icons end -->
          <button class="navbar-toggler navbar-toggler-right hidden-lg-up align-self-center" type="button" data-toggle="offcanvas">
               <span class="navbar-toggler-icon"></span>
          </button>
     </div>
</nav>
<!--End navbar-->
After adding the code, the top navbar part is done.
The sidebar
The second part is the left sidebar. The sidebar has only one list item, that is the dashboard. So we need to remove or comment the rest of the list items. After doing that there are only the profile picture and the dashboard menu item in the sidebar.
The content area
The third part is the content area. In the index.html page, the first element that you see on the top of the page is the four small cards in the same row. In our design, we have a bar chart and a donut chart.
There is no bar chart on the index page, so I head to the charts page where I have all the charts I need. I get the code for the bar chart. The bar chart and the donut chart show related data. So, both the data are placed in the same card within the same row. The below code shows how it is done.
<div class="row">
     <div class="col-lg-12 col-12 mb-4">
          <div class="card">
               <div class="card-block">
                    <div class="row">
                         <div class="col-lg-6 col-12">
                              <h5 class="card-title mb-4">Types of Traffic</h5>
                              <canvas id="barChart" style="height:230px"></canvas>
                         </div>
                         <div class="col-lg-6 col-12">
                               <h5 class="card-title mb-4">Traffic Sources</h5>
                               <canvas id="doughnutChart" style="height:250px"></canvas>
                         </div>
                    </div>
               </div>
          </div>
     </div>
</div>
The data displayed originally on the charts are not the data that are required in the design. So go to the chart.js file and change the data to be displayed. Later this data can be changed dynamically when connected with the database to show the real-time changes in data.
After the two charts, there are three small cards that display the number of visitors, sales, and revenue. These cards are taken from the index page of the template. But on the index page, there are four cards in the row and we have only three per row. So, we need to make some necessary changes.
Also, there are no icons on the cards, so we head straight to the widgets page where there are similar cards with icons. Copy the code for the icons and paste them where it is needed.
 <div class="row">
      <-- Visitors card -->
      <div class="col-xl-4 col-lg-4 col-md-4 col-sm-6 mb-4">
           <div class="card">
                <div class="card-block">
                     <div class="clearfix">
                          <i class="fa fa-user-o float-right icon-grey-big"></i>
                     </div>
                     <h4 class="card-title font-weight-normal text-success">7874</h4>
                     <p class="card-text">Visitors</p>
                     <div class="progress">
                          <div class="progress-bar progress-bar-striped bg-success" role="progressbar" style="width: 75%" aria-valuenow="75" aria-valuemin="0" aria-valuemax="100">75%
                          </div>
                     </div>
                </div>
          </div>
     </div>
     <-- Visitors card ends -->
     <-- Sales card -->
     <div class="col-xl-4 col-lg-4 col-md-4 col-sm-6 mb-4">
          <div class="card">
               <div class="card-block">
                    <div class="clearfix">
                         <i class="fa fa-shopping-cart float-right icon-grey-big"></i>
                    </div>
                    <h4 class="card-title font-weight-normal text-info">75632</h4>
                    <p class="card-text ">Sales</p>
                    <div class="progress">
                         <div class="progress-bar progress-bar-striped bg-info" role="progressbar" style="width: 40%" aria-valuenow="40" aria-valuemin="0" aria-valuemax="100">40%</div>
                         </div>
                    </div>
               </div>
          </div>
     </div>
     <-- Sales card end -->
     <-- Revenue card -->
     <div class="col-xl-4 col-lg-4 col-md-4 col-sm-6 mb-4">
          <div class="card">
               <div class="card-block">
                    <div class="clearfix">
                         <i class="fa fa-bar-chart float-right icon-grey-big"></i>
                    </div>
                    <h4 class="card-title font-weight-normal text-danger">$ 89623</h4>
                    <p class="card-text">Revenue</p>
                     <div class="progress">
                          <div class="progress-bar progress-bar-striped bg-danger" role="progressbar" style="width: 65%" aria-valuenow="65" aria-valuemin="0" aria-valuemax="100">65%</div>
                     </div>
                </div>
           </div>
      </div>
      <-- Revenue card ends -->
 </div>
And finally what we need is the table and the chart. We already have a similar component on the widgets page. So we take that code and copy paste it into the dashboard and make the necessary changes in the data.
<div class="row mb-4">
<div class="col-xl-12 col-lg-12 col-md-12 col-sm-12">
<div class="card">
<div class="card-block">
<h5 class="card-title mb-4">Source Countries</h5>
<div class="row">
<-- table -->
<div class="col-xl-5 col-lg-5 col-md-12 col-sm-12 col-xs-12">
<table class="table table-striped">
<tbody>
<thead>
<th></th>
<th>Country</th>
<th>Sessions</th>
<th>Goals</th>
<th>Conversion Rate</th>
<th>Bounce Rate</th>
</thead>
<tr>
<td>
<div class="flag">
<img src="../images/flags/US.png">
</div>
</td>
<td>USA</td>
<td class="text-right">
96550
</td>
<td class="text-right">
300
</td>
<td class="text-right">
4.89%
</td>
<td class="text-right">
0.44%
</td>
</tr>
<tr>
<td>
<div class="flag">
<img src="../images/flags/DE.png">
</div>
</td>
<td>Germany</td>
<td class="text-right">
54866
</td>
<td class="text-right">
250
</td>
<td class="text-right">
2.25%
</td>
<td class="text-right">
0.25%
</td>
</tr>
<tr>
<td>
<div class="flag">
<img src="../images/flags/AU.png">
</div>
</td>
<td>Australia</td>
<td class="text-right">
56988
</td>
<td class="text-right">
150
</td>
<td class="text-right">
4.00%
</td>
<td class="text-right">
0.33%
</td>
</tr>
<tr>
<td>
<div class="flag">
<img src="../images/flags/GB.png">
</div>
</td>
<td>United Kingdom</td>
<td class="text-right">
54698
</td>
<td class="text-right">
99
</td>
<td class="text-right">
2.35%
</td>
<td class="text-right">
0.56%
</td>
</tr>
<tr>
<td>
<div class="flag">
img src="../images/flags/RO.png">
</div>
</td>
<td>Romania</td>
<td class="text-right">
15640
</td>
<td class="text-right">
139
</td>
<td class="text-right">
0.89%
</td>
<td class="text-right">
0.14%
</td>
</tr>
<tr>
<td>
<div class="flag">
<img src="../images/flags/BR.png">
</div>
</td>
<td>Brasil</td>
<td class="text-right">
10800
</td>
<td class="text-right">
98
</td>
<td class="text-right">
0.22%
</td>
<td class="text-right">
0.35%
</td>
</tr>
</tbody>
</table>
</div>
<-- Table ends -->
<-- Map -->
<div class="col-xl-7 col-lg-7 col-md-12 col-sm-12 col-xs-12">
<div id="map" style="min-height:300px;"></div>
</div>
</div>
<-- Map ends -->
</div>
</div>
</div>
</div>
So, that creates our dashboard. Now we can start adding and changing styles according to the specific needs. Customize the template to make it your own and have fun with it.
Summary
Let’s go through all of the above steps in short
- Decide on the requirements.
- Find the right template and download.
- Install tools like npm, gulp etc. to automate and speed up the development.
- Install all the dependencies of the template.
- Edit the code to get the admin panel of your design.
Bootstrap admin templates really help you jump-start your project. You don’t have to build everything from the ground up. All you need to do is find the right template and then you are good to go. It is better to make sure that the template you have is the right one otherwise, you will end up wasting all the time that you intended to save.
Comments(2)
Markus dAvis
October 4, 2020
Thanks! The tutorial really helped me understand admin templates!
Absekssniff407
February 5, 2021