
JavaScript charting libraries are powerful tools in data visualization in websites, web applications, and mobile applications. They are an integral part of dashboards and other business-related data analysis and reports.
In the age of big data, it is impossible to make anything out of the huge amount of data that is received by the minute, let alone get insights and make decisions, without the proper data visualization techniques.
Finding the right JavaScript library for your project can be time-consuming. Below I have listed some beautiful JavaScript charting libraries that can help you create amazing charts for your project. I have considered certain factors like the design, responsiveness of the charts, free versions of the library, stand-out features, support, and documentation on the list.
I have considered certain factors like the design, responsiveness of the charts, free versions of the library, stand-out features, support and documentation on the list.
Top Premium JavaScript Charting Libraries
Fusion charts
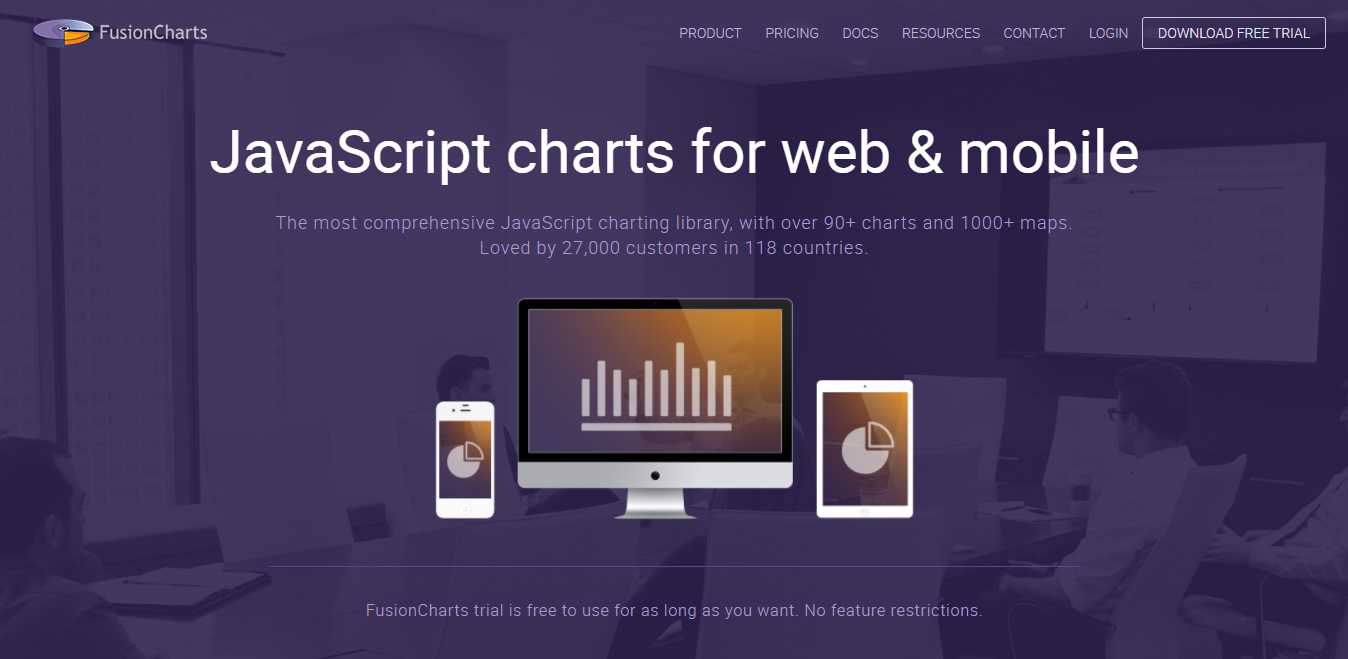
Fusion charts is a premium JavaScript charting library that boasts to have more than 90 charts and more than 1000 maps. All these charts are rich in features that are both helpful in understanding the data and improving the UI. These features include importing the chart as images or as a PDF file, zooming and scrolling of the charts, label management, tooltips, glass effect on charts, visually editable charts and more.
They have a very good documentation and support is provided by sending a message through their website or via email. The website also has an active forum that is updated regularly.
You can download free trial version of the library and use it without any limitation to features.
Canvas.js
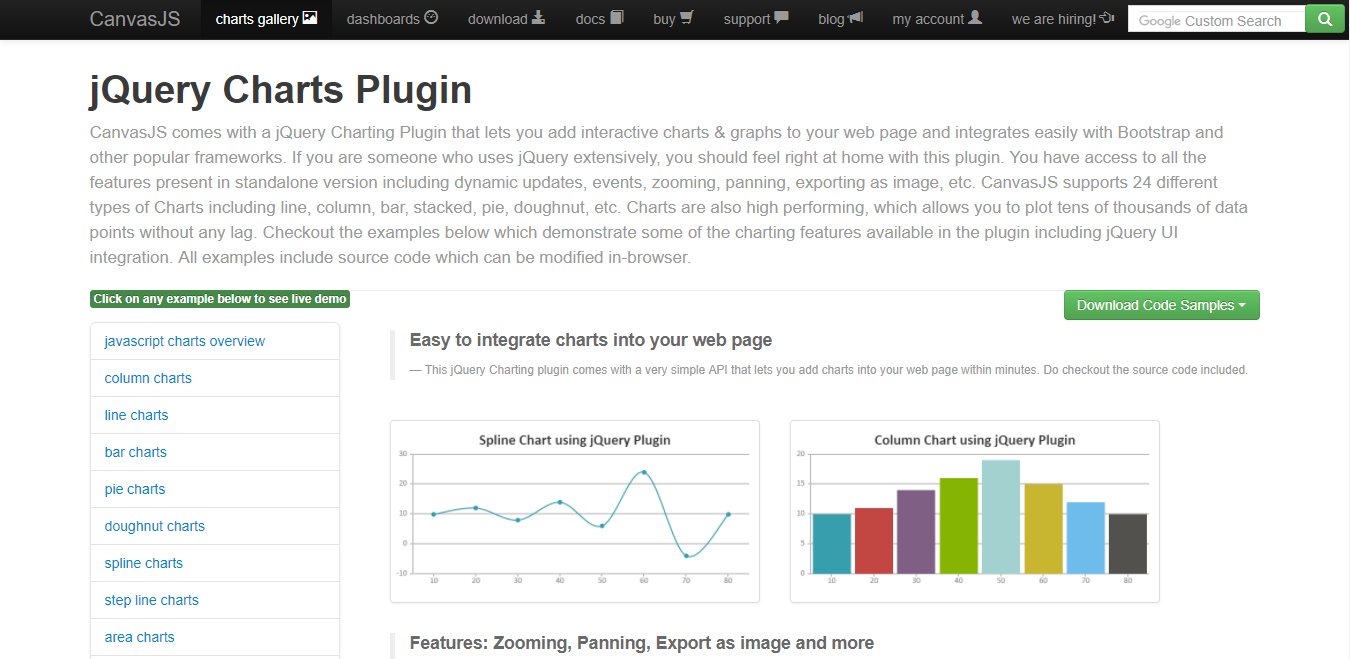
CanvasJS is free JavaScript charting library that supports 24 different types of JavaScript charts that include candlestick charts, Range spline area charts, OHLC charts, scatter plot charts, stacked column chart etc. It works with almost all kinds of devices supporting almost all operating systems including iOS, Android, and windows.
The charts in CanvasJS are responsive so that it is compatible with devices of any screen size. These charts come with themes that can be used to beautify the charts.
Getting started with CanvasJS is made easy with excellent illustrations and documentation. In the case of any issues or bugs, you can raise the issue and report the bugs in their community forum.
HighCharts
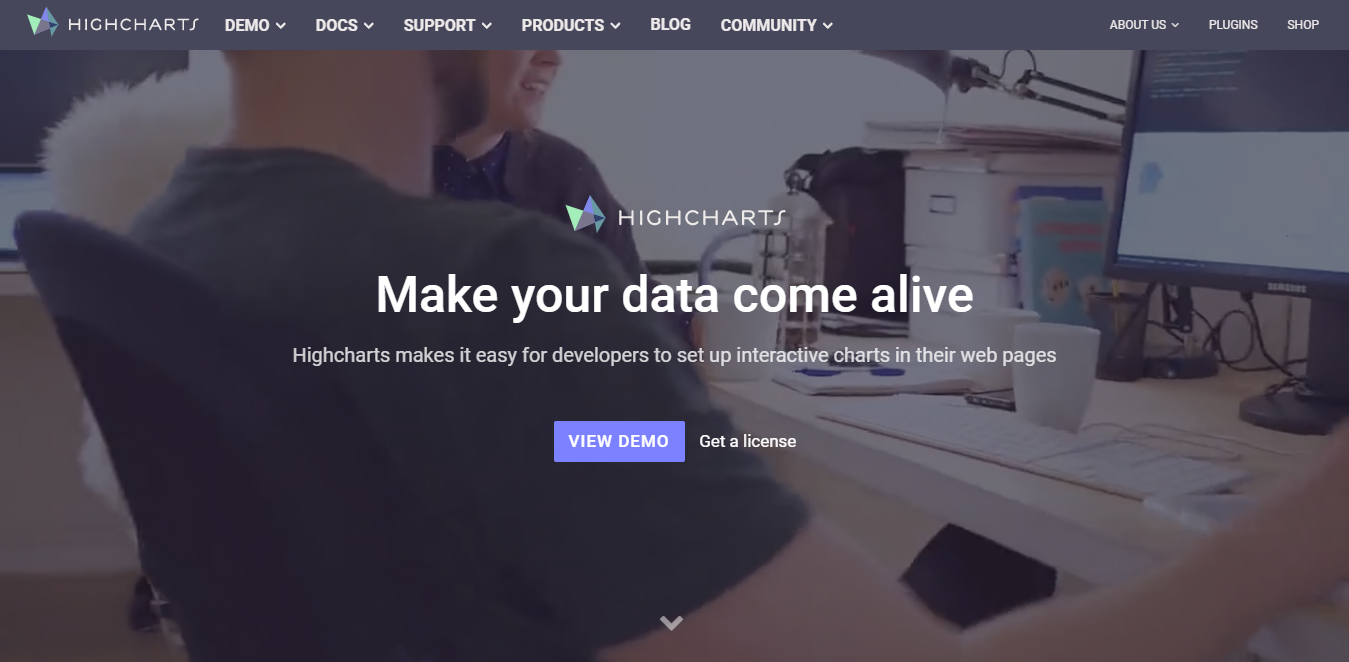
Highcharts charting library is written purely in JavaScript and support a wide range of charts. It is very fast, responsive, highly customizable, touch optimized, dynamic and the feature list goes on.
The library has good documentation which would be enough to get started and going and refer to if there is any problem along the way. If there are any issues that get you stuck, you can drop a question in their support forum and your question will be answered by their community. Any unanswered questions will be attended to by their support team.
You can also get premium support by emailing and raising a ticket with a response time of 24 hours or by chatting directly with them.
Highcharts is free for non-commercial use.
AmCharts
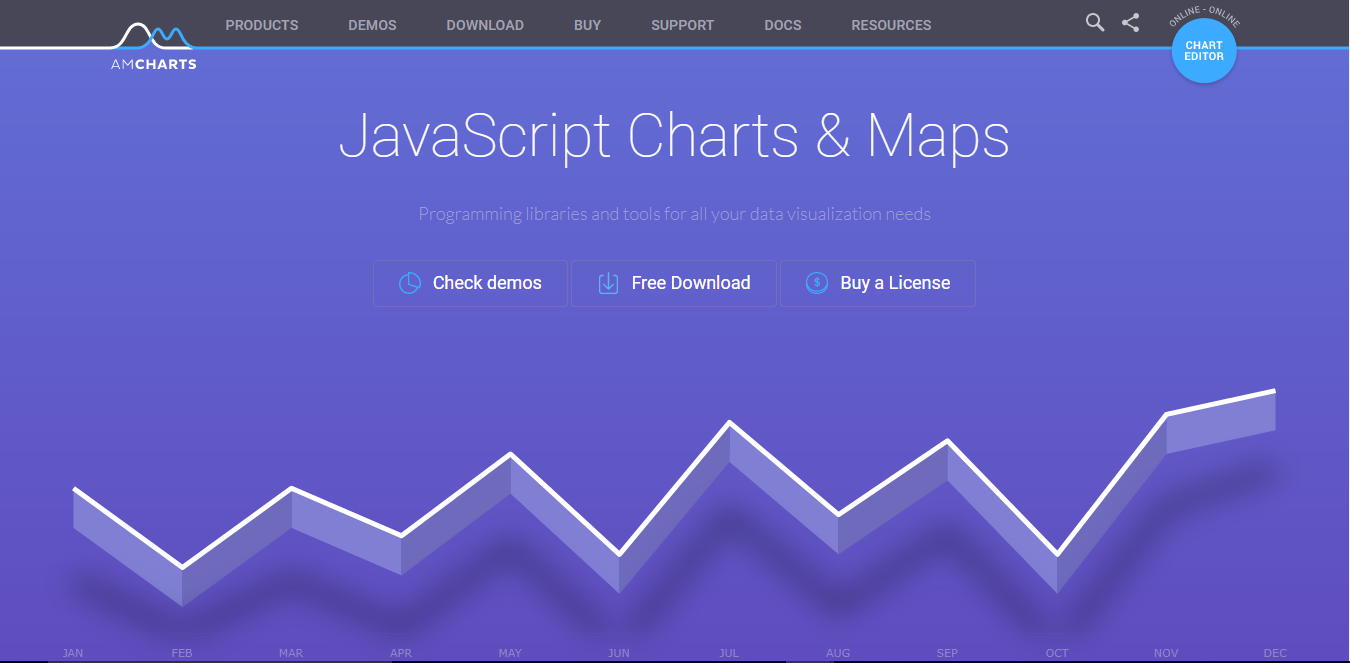
AmCharts JavaScript charting library contains a huge collection of charts, graphs, and maps. These are highly customizable, clean, and responsive charts with great design. One of the highlights of this library is that it already comes with 6 different themes to style the charts.
The charting library comes with good documentation and in case of support, they claim to take it more seriously than anyone else. You can get support by emailing them or submitting a support request on their website.
You can use all the charts in the charting library for free with a link to the websites on the top left corner of the charts. This link will not have to be displayed if you get the premium version.
ZoomCharts
ZoomCharts has a gallery full of interactive charts for data visualization. The charts are completely responsive, clean and fast charts with stunning visuals and great animations. The types of charts provided by the library are categorized into chart families which are a net chart, time chart, facet chart, and geo chart. You can purchase these chart families separately.
ZoomCharts supports all of the modern devices and the charts can be exported in various formats. The library has detailed documentation for the charts and provides good support via email with a response time of 1 working day. You can also get priority support.
ZoomCharts does not provide a free version but you can request a trial of the charts.
<
ZingCharts
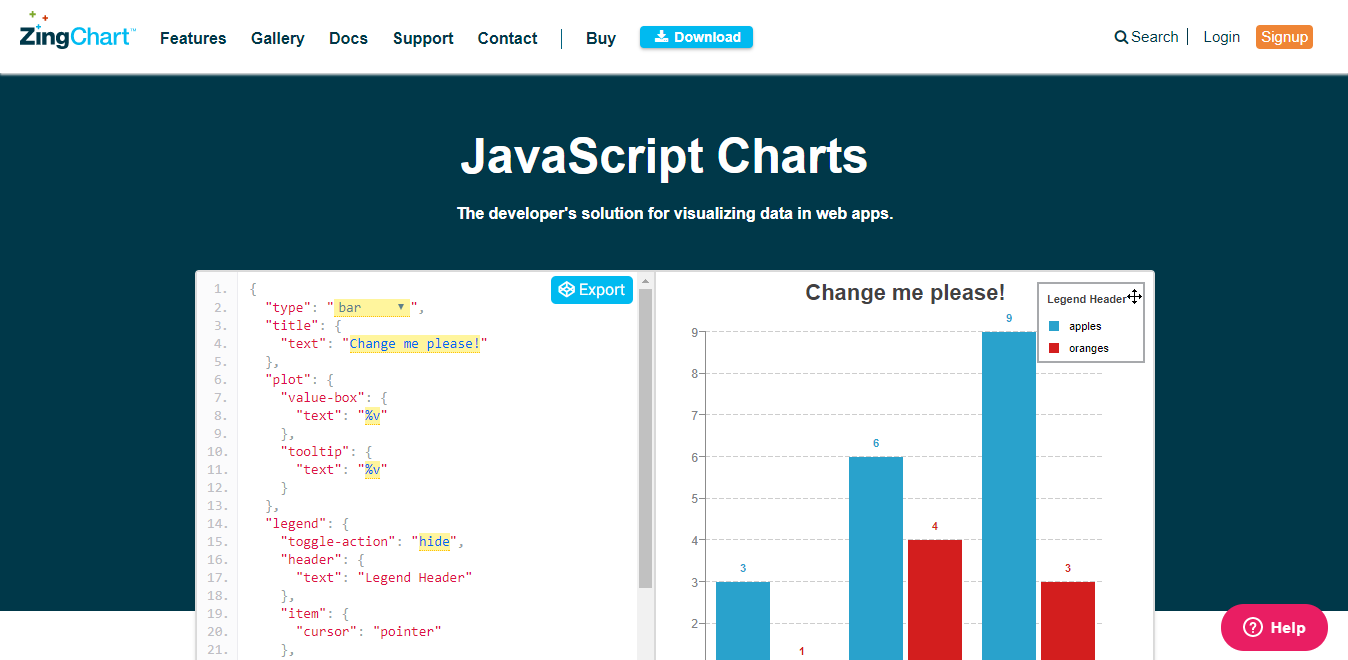
Zingcharts consists of more than 35 chart types and modules. These charts are responsive, touch-enabled, and powerful. They come with the variations of 6 different themes. They also come with animations and 3D effects. You can see examples of the extensive list of charts in their gallery.
The documentation for the library is great. They provide support via chat and email. You can also make use of their paid support. You can contact them through the phone as well, details of which have been provided on their website.
You can use all the charts in the library with a free license but must display ZingCharts watermark and link at all time.
Plotly
Plotly javascript charting library has an incredible collection of charts and graphs for data representation. Plotly has high charts with high-quality graphics. They are responsive, clean, interactive and neatly designed.
Plotly has extensive documentation for all kinds of the purposes that the charts are used for. Support is provided by raising a ticket. There is a free online community as well. You can also request for features or vote on existing feature requests.
Plotly is free to use with a community plan in which you get slightly fewer features and benefits than the premium one.
JS Charts
JSCharts are highly customizable and can be easily integrated. The library has a collection of three types of commonly used charts – line charts, bar charts and pie charts. The library has cross-browser and cross-platform compatibility.
They have documentation on how to get started with using the charts. You can raise a ticket on their support page in case there is an issue and you could search through their forum for similar issues or to join or start a discussion.
JSCharts provide a free version to get all the charts but the charts are watermarked. If you don’t mind the watermark then you can use the free version. But if you need to remove the watermark, then you have to get the premium version.
Rappid
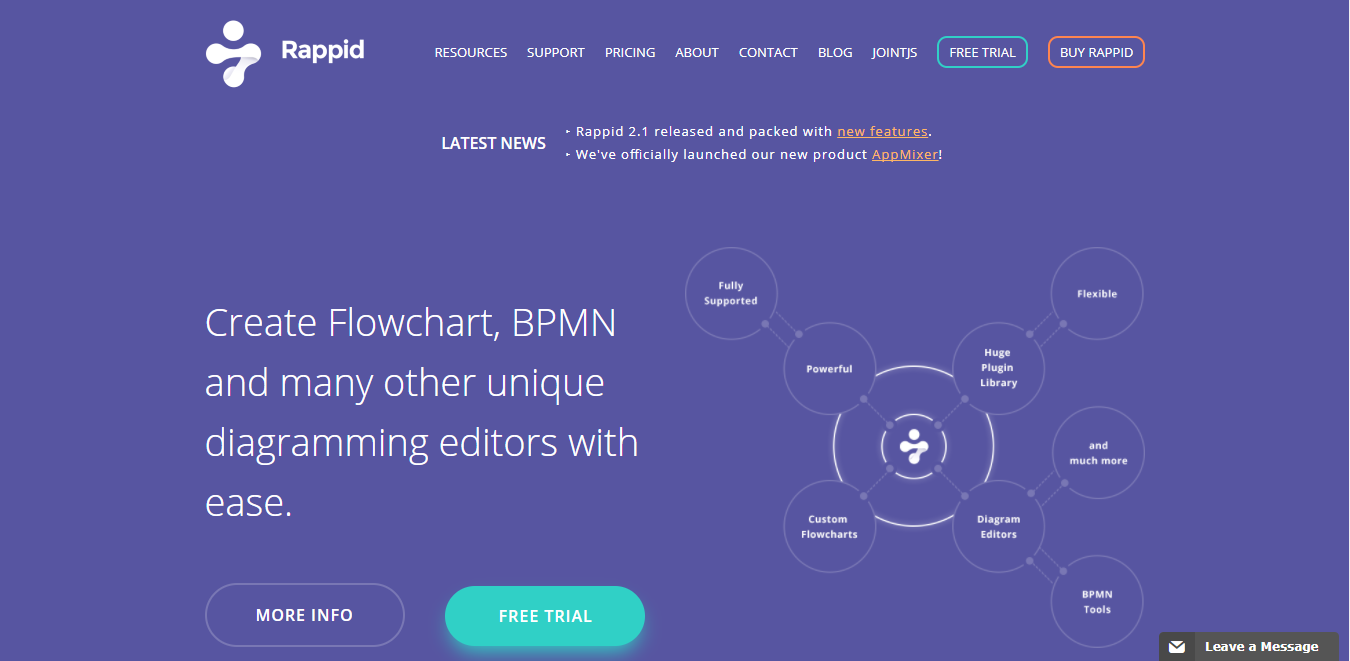
With Rapid you can create more than just charts and graphs. You can create flowcharts and diagrams with it. It is cross-browser and cross-platform compatible. It is highly customizable, responsive and has high-quality graphics. The diagrams can be exported in different formats.
The documentation is great with tutorials to get started with each of the elements. Rapid provides paid support as well.
You can have a free trial for Rapid before you decide to purchase the license for the library.
AnyChart
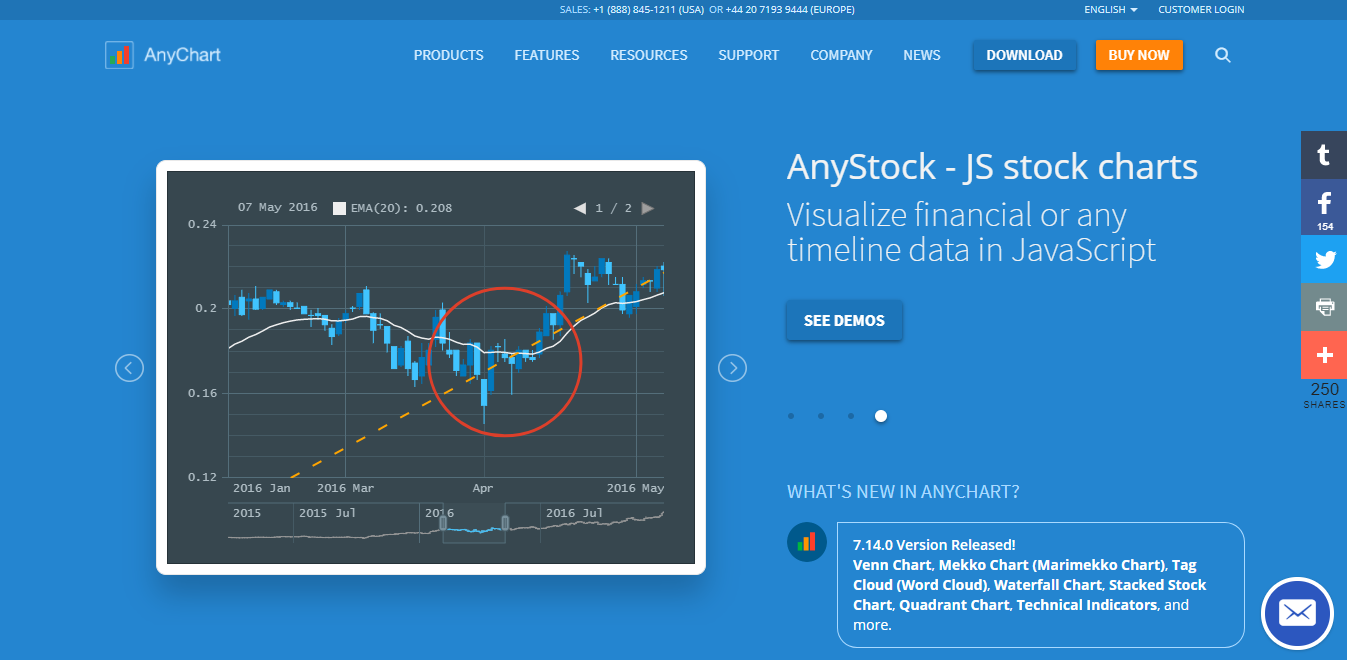
AnyCharts JavaScript charting library contains 80 different chart types and also allows you create a chart type of your own. The charts are completely responsive and highly customizable. The charts already come with a lot of different combinations of themes and color palettes. You can export the graphs in different formats and share them on various social media platforms.
For support, you can reach their support team via email or contact directly via live chat.
You can also download the trial version for the library by filling out a form. The download link will be provided in an email to the email address you provided.
TeeChart
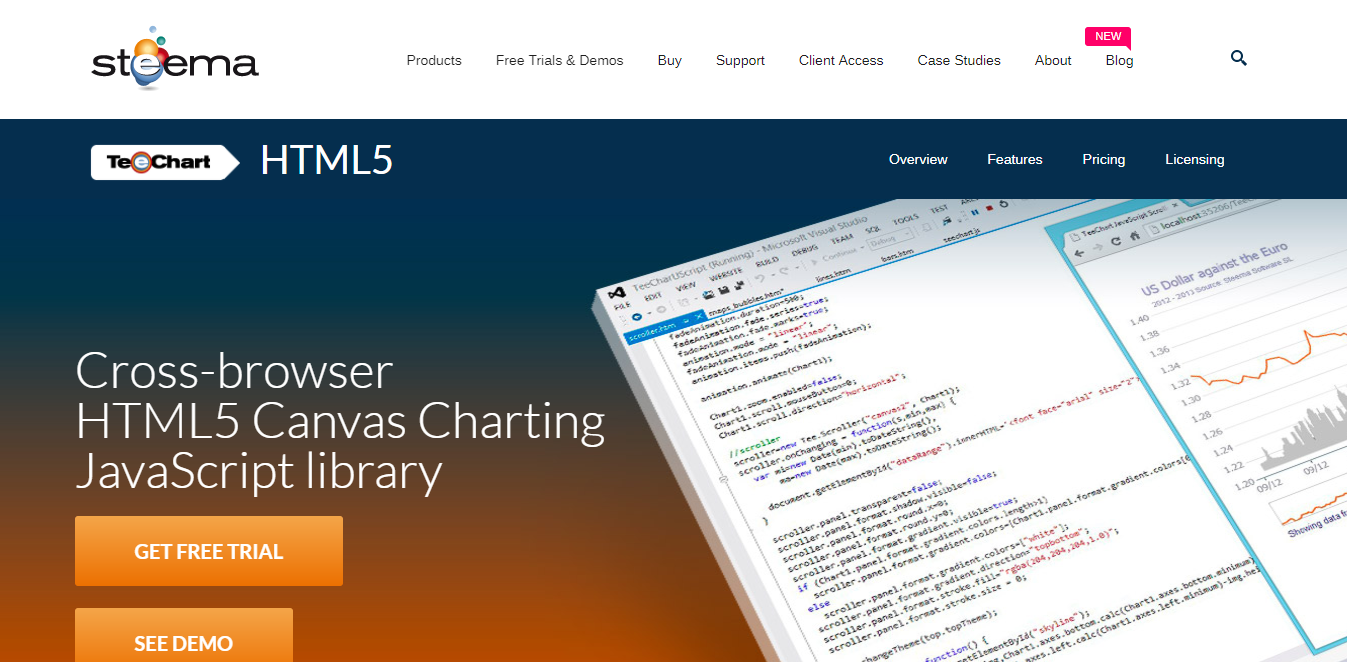
TeeCharts from Steema charting library consists of different types of charts that are cross-browser compatible. You can have different themes and color paletted for the charts that are from the prebuilt themes and color palettes. They also have interactive zooming and scrolling for mouse and touch-enabled devices.
You can get started with TeeCharts with the help of demos, user guides, tutorials, and examples. They provide free support and priority support which is paid and for one year.
You can use TeeCharts for non-commercial use and can have a free trial before purchasing for commercial purposes.
VanCharts
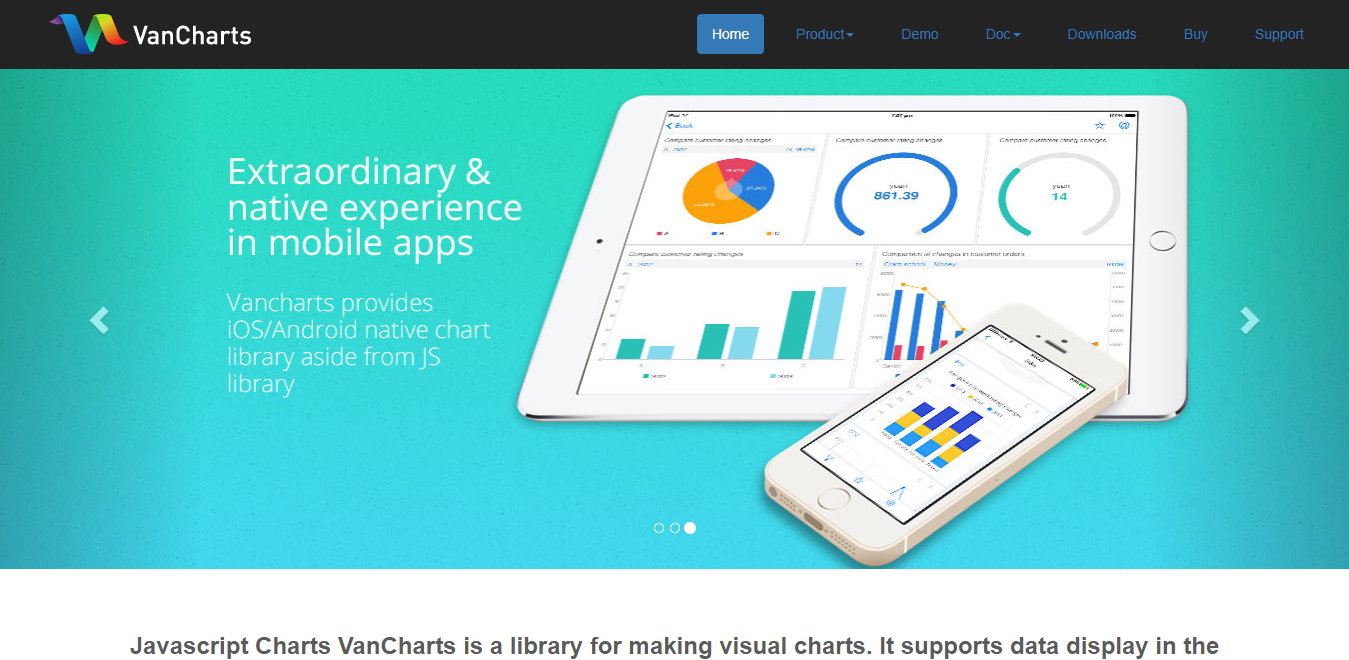
VanCharts have a collection of more than 30 chart types. The charts are cross-browser and cross-platform compatible, highly customizable, responsive, and clean design. They have 10 built-in color schemes to choose from.
In case of any issues, you can refer to the documentation of VanCharts. If the issues are not solved even then, you can reach them via email and expect a response within a day.
You can download the library for non-commercial purposes for free.
Conclusion
From the above list, the best-suited library for your project depends on the requirements of your project. It’s very tempting to go for the library that has all the charts and graphs and has the most functionality. But, if the requirement of your project is not that of a big library, then choosing a small library would be the wise choice to avoid unnecessary options and a waste of time.
All of the above charting libraries are premium and you have limitations when using the free version. However, you can also check out the free charting libraries that are available and you may find the right fit for your project without any cost.
BootstrapDash believes in providing the best, most efficient, and quality bootstrap admin templates to get your web application up and running easily and quickly.