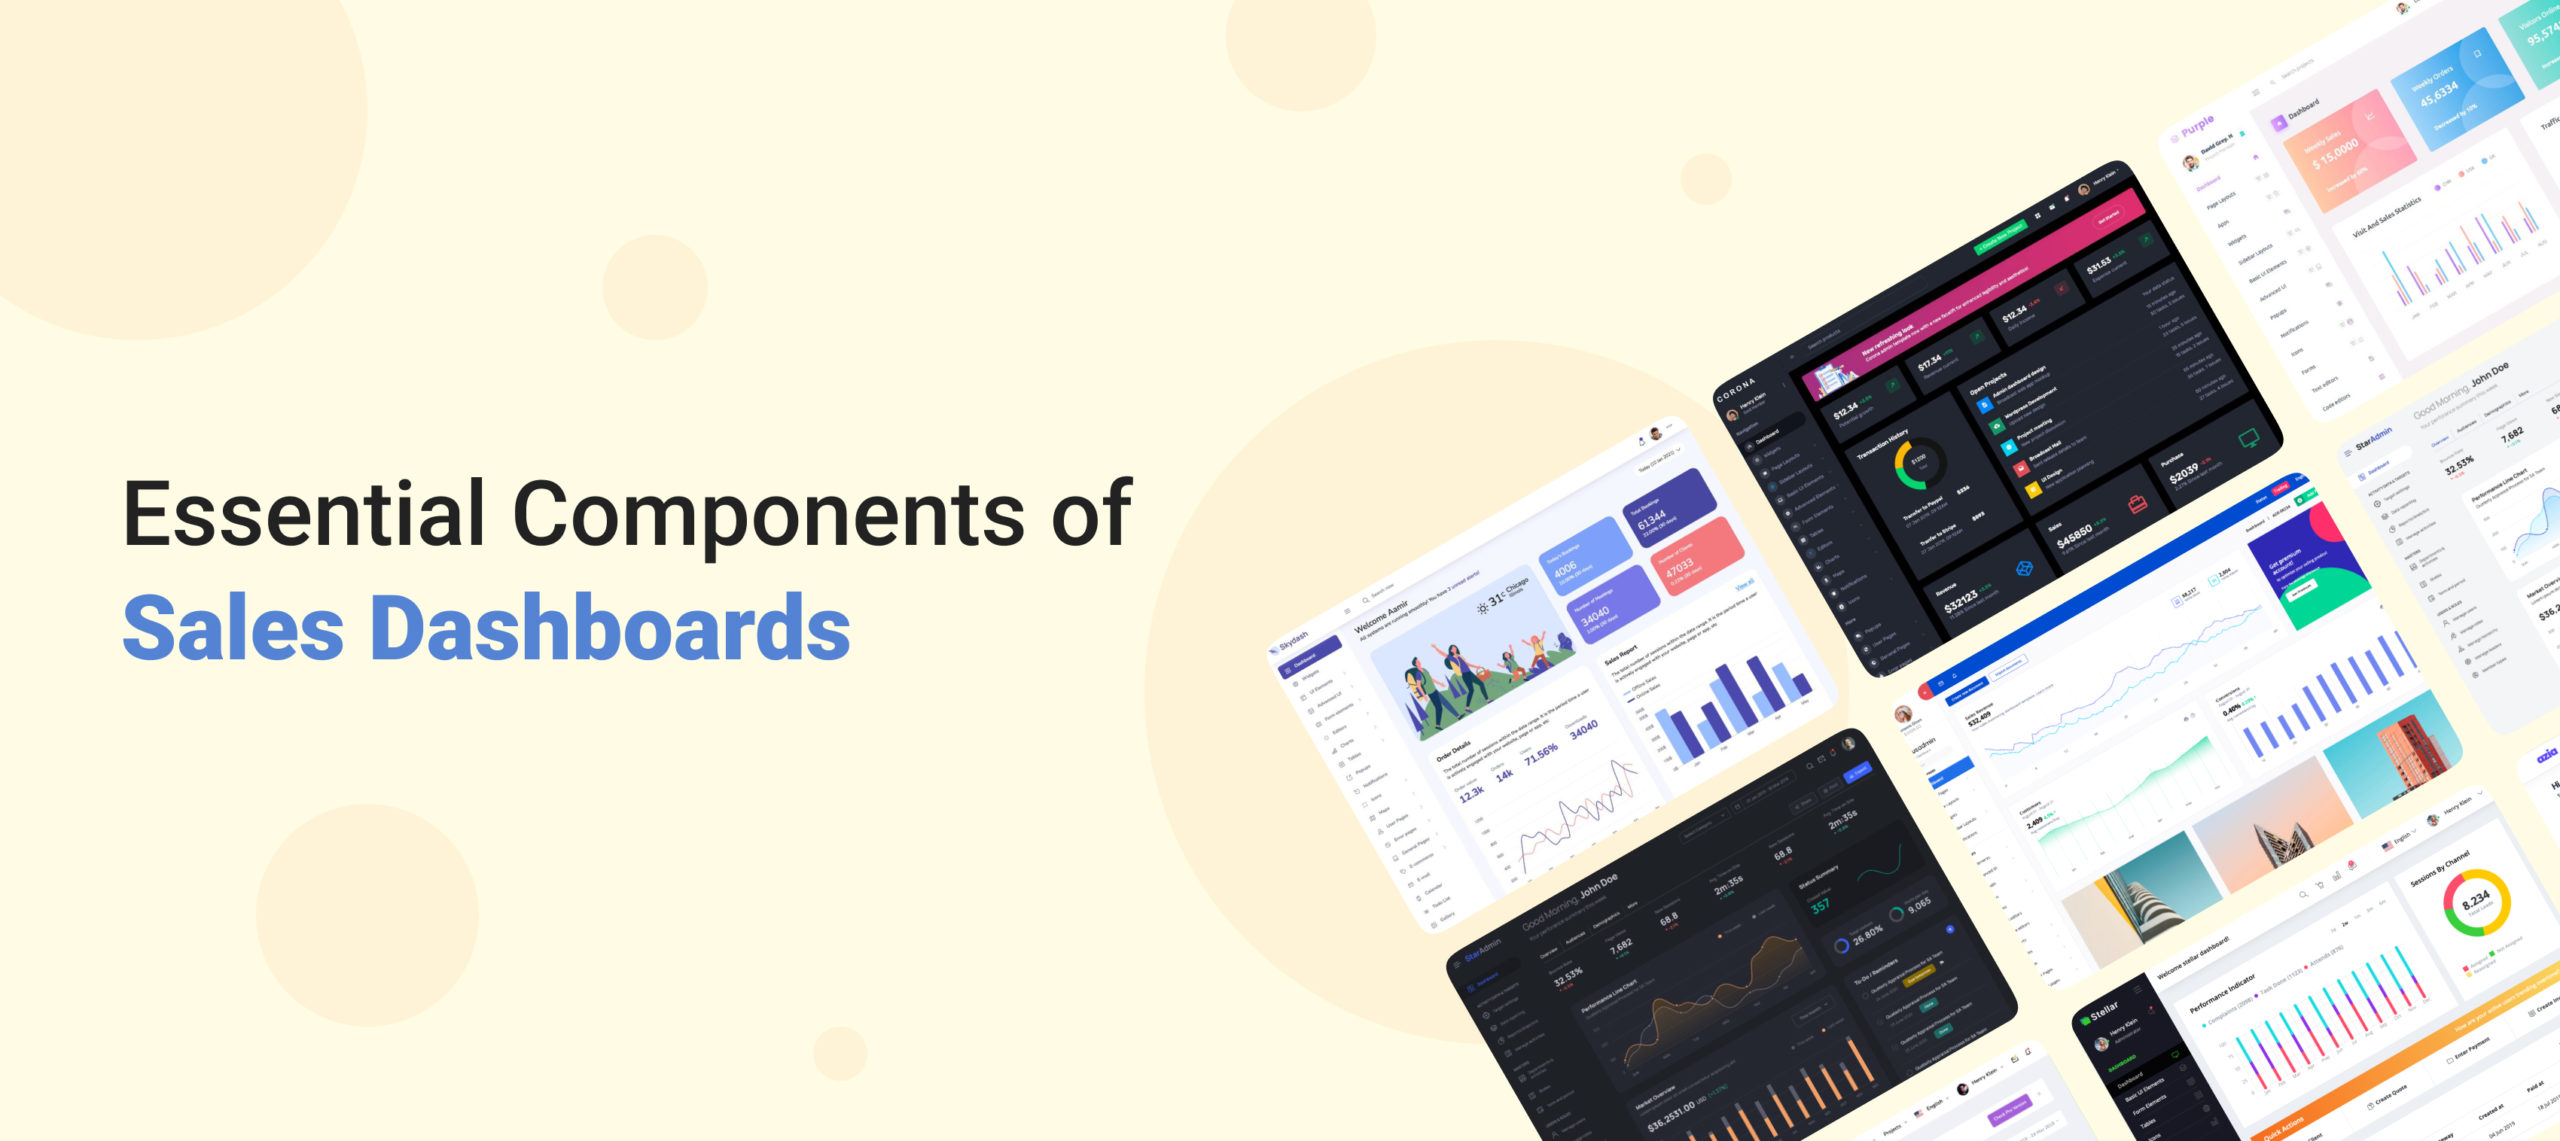
What Are Sales Dashboards?
Sales dashboard is a tool that helps sales executives and managers monitor and draw actionable insights from metrics and KPIs related to sales performance through visual representation of sales data. Sales dashboards are inevitable in modern sales management for navigating sales tasks and making critical decisions. Jumbling between various reports and arriving at a conclusion can be a tedious job for the sales department if they rely on manual data reporting and intuitive decisions. That is not a serious approach towards sales management. Sales dashboards pull data from across departments real-time and provide a central platform that can be relied on for tasks from monitoring data to taking data-driven actions.
Having a sales dashboard is the simplest way to keep the data, tasks and goals of the sales team organized. The data showcased by the dashboard let the team know where they stand in terms of performance and target achievement. This helps the team calibrate their work and complete tasks on time. Sales dashboards enable the sales executives to have an overview of sales performance filtered by the time-period, locations and other parameters they employ. In short, sales dashboards empower sales management with intelligent interpretation and usage of sales data. You can also use affordable CRM software to increase productivity.
Things to Keep in Mind While Building Sales Dashboards
Being mindful of a few things while building a sales dashboard can make a huge difference in its efficiency. The sales management approach varies from one company to another. It is not possible to make a fit-for-all dashboard that works for every sales department. So the way you customize your dashboard is very important. Ask yourself these questions before you build a sales dashboard for you:
-
What is the purpose of your dashboard?
Determine why you need a dashboard in the first place. There could be various factors that led you to think of having a salesboard. You might be finding difficulty in managing all data or tracking the performance of your sales team is not going well. There could be more reasons as well. Knowing the exact purpose lets you choose the right metrics and components to be included in the dashboard. afterall , the efficiency of a dashboard is measured by the extent to which it serves your purpose.
-
Who all needs the dashboard in your company?
Any dashboard caters different insights to different members/departments of an organization. What your sales manager looks for in a dashboard would be very different from what your CEO needs from it. So, ensuring that the dashboard works for all who depend on it is detrimental. List out who all needs a sales dashboard in your organization. Consult them and know their exact needs. These insights would come handy while customizing.
-
What are the relevant metrics for your sales team?
Metrics are at the heart of sales dashboards. Though some general metrics like sales funnel apply for every sales dashboard, KPIs and metrics also need a conscious choosing. Always try to keep the most relevant metrics and leave the unnecessary KPIs that would clutter your interface.
-
What type of visual representation works for you?
A variety of charts and graphs are offered by premium sales dashboard templates. It includes pie charts, bar graphs, dials, funnels etc. Charts that give you the relevant data at a glance are what you ideally choose for your dashboard. Data analysis shouldn’t be difficult despite having a dashboard.
-
What template gives your dashboard the perfect look?
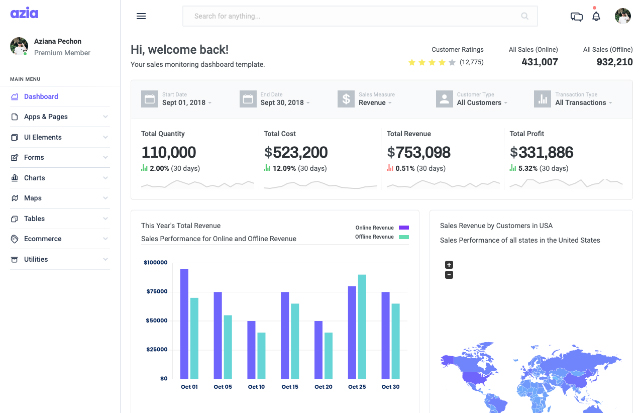
Today, you have tons of sales dashboard templates in the market and choosing the right template might be frustrating. But again, being mindful of a few things can make it easier. While you look for the functionality, don’t forget to focus on the design and colour scheme as well. Keeping your dashboard minimal is the key. Cluttered components and overwhelming colours could be a sore to the eyes. Templates like Star Admin Pro and Azia Admin are some of the best sales dashboards that are made paying attention to both functionality and appearance.
Azia Admin- sales monitoring dashboard template
Must-Have Components for Sales Dashboards
As said earlier, components to be included in the sales dashboard is an area that needs conscious filtering from its users. Yet, there are some fundamental metrics and KPIs that are relevant for every dashboard. Having these components is necessary to bring out the maximum out of the sales dashboard. Here’s a list of some components that you would not want to miss in your sales dashboard:
-
Sales Growth
Sales Growth metric indicates the growth of your organization. It is important in analyzing if your company is heading in the right direction in terms of sales. This metric allows you to compare the sales growth over certain periods of time giving you good insights into the changes you need to adopt in the company, if any.
-
Sales Target
Sales target gives you insights into the performance of the sales team in terms of achieving targets and completing tasks. This way you get an idea of when and where your sales team needs a boost in the performance. Knowing this real-time can avoid the risk of delay in achieving the goals.
-
Lead Conversion Ratio
Lead conversion ratio measures the number of leads that converts into customers. By implementing small business phone services or using email marketing, you can ensure the greatest lead generation strategy. Studying this KPI closely gives you an idea of how many leads are needed to be worked upon to achieve the target. This insight can be used to fix the benchmark for sales pipeline as well. So, this KPI is useful at many levels.
-
Number of Sales Opportunities
Sales management relies heavily on sales opportunities. Having a good grasp over the potential purchase volume is must for sales executives. Metrics that show the number of sales opportunities tell you if the sales performance is on the right track. Graphs that provide comparative data makes the analysis of sales opportunities even more effective.
-
Customer Acquisition Cost
Customer Acquisition Cost is basically the ratio of total spend spend and total number of customers acquired. CAC lets you know if your campaigns and marketing are attracting enough customers. This metric along with Customer Lifetime Value (LTV) and Average Revenue Per Unit (ARPU) define the profitability.
-
Customer Lifetime Value (LTV)
Customer Lifetime Value metric essentially tells you how long and how much revenue a customer pays the company. This is an important factor in measuring the profit of the company. High LTV indicates high profits. Insights from this metric could be helpful in Customer Relationship Management as well.
-
Customer Churn Rate
In sales tracking the number of lost customers is as important as the number of lead conversions. Customer Churn Rate is a relevant metric in this regard. It is, mathematically, the ratio of Number of customers lost and the total number of customers in the beginning of a month or any time frame that you fix. A company should always strive to lower the Customer Churn Rate as much as possible. The insights this metric gives could be used while forming retention strategies.
-
Sales Pipeline
Sales Pipeline lets you know at what stage the opportunity is in. This info is of top priority when strategizing lead conversions. Tracking leads and opportunities through their various stages help you navigate the sales funnel effectively.
Conclusion
Sales Dashboards save your time and effort by making your organization go data-driven. Making use of data for the meticulous planning of strategies and actions can take your sales ahead in the competition. It is not the amount of data you could procure, but the insights you can draw from the available data that changes the game. This is why sales dashboards are extremely relevant in today’s business. Building an efficient sales dashboard would not be a tough job if you ensure you include all the relevant components and are little mindful while choosing the template.